Your Product Is on Amazon and Flipkart. So, Why Aren't You Getting Sales?
You invested in product development. You completed registrations. You uploaded listings on Amazon and Flipkart. Maybe you even spent lakhs on ads.
Yet sales remain inconsistent. You are watching competitors with inferior products sell 100+ units weekly while your inventory sits collecting dust.
If you've ever searched “Why My Product Is Not Selling on Amazon and Flipkart”, you're not alone. The same question 78% of Indian e-commerce sellers ask themselves. This isn't a story about bad products; the problem is invisibility, weak listing optimization, low conversion rates, and ineffective advertising.
The Real Reasons Your Product Isn't Selling
Many brands assume that listing products on marketplaces automatically generates sales. Unfortunately, marketplace algorithms don't work that way.
Fun Fact: According to Amazon, over 70% of shoppers never go beyond the first page of search results. Similarly, products appearing in the top positions on Flipkart receive significantly higher click-through rates than lower-ranked listings.
Here are the main reasons behind it:
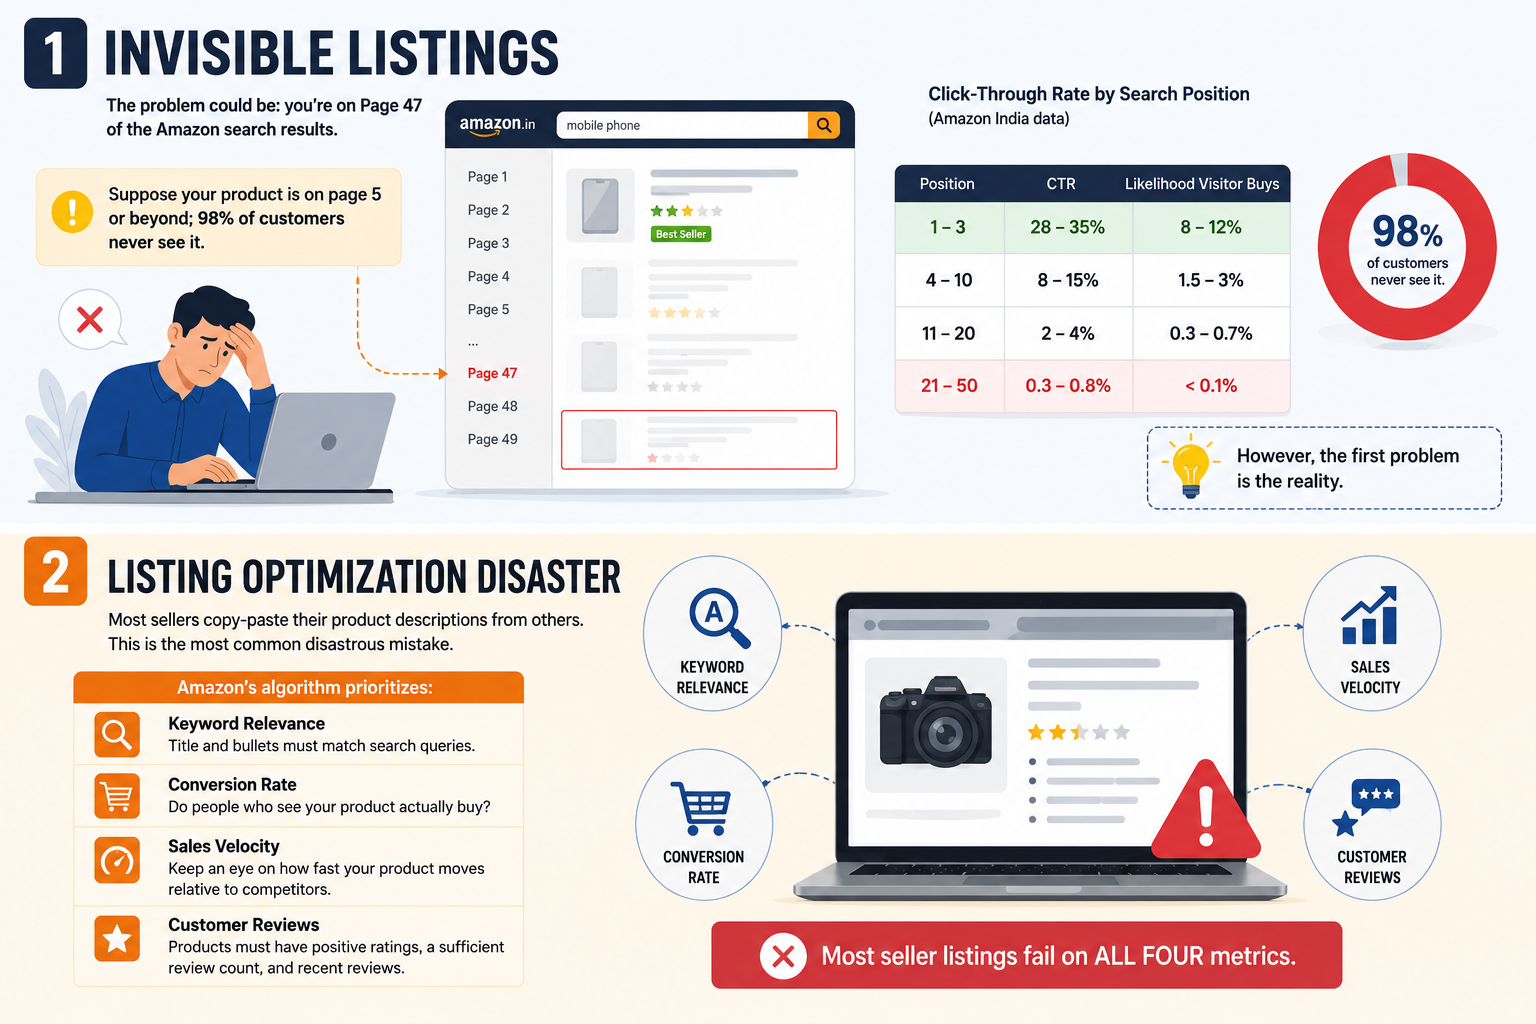
Reason 1: Invisible Listings
The problem could be: you’re on Page 47 of the Amazon search results. This isn't speculation; it's math.
Click-Through Rate by Search Position (Amazon India data):
|
Position |
CTR |
Likelihood Visitor Buys |
|
1-3 |
28-35% |
8-12% |
|
4-10 |
8-15% |
1.5-3% |
|
11-20 |
2-4% |
0.3-0.7% |
|
21-50 |
0.3-0.8% |
<0> |
Suppose your product is on page 5 or beyond; 98% of customers never see it. However, the first problem is the reality.
Reason 2: Listing Optimization Disaster
Most sellers copy-paste their product descriptions from others. This is the most common disastrous mistake. What happens is, Amazon’s algorithm prioritizes:
- Keyword Relevance: Title and bullets must match search queries.
- Conversion Rate: Do people who see your product actually buy
- Sales Velocity: Keep an eye on how fast your product moves relative to competitors.
- Customer Reviews: Products must have positive ratings, a sufficient review count, and recent reviews.
Read More: What Are the Types of Digital Marketing
Most seller listings fail on ALL FOUR metrics.
Reason 3: Ad Budget Bleeding
Many sellers think that spending money on ads without a strategy. The average pattern of seller ad spend goes like:
- Month 1: 30,000 budget, 0.8x ROAS (losing 6,000).
- Month 2: 50,000 budget (doubling down on failure), 0.9x ROAS (losing 5,000).
- Month 3: 75,000 budget (panicking), 0.7x ROAS (losing 22,500).
- Total Bleed: 33,500 lost in 3 months.
The tragedy A better strategy would have yielded 3-4x ROAS. But sellers don't know what “better strategy” looks like.
Reason 4: Price Undercutting
When products don't sell, sellers cut prices. That’s basically the first point of action most sellers take. The common practices amongst them are:
- You list at 5,000. No sales.
- You cut to 4,500. Still no sales.
- You panic-cut to 3,999.
- Competitors see this and also cut their prices.
- The category gets destroyed, and at the end, everyone's margins compress to 30-40%.
Price-cutting doesn't fix the sales; it just makes the problem profitable for nobody.
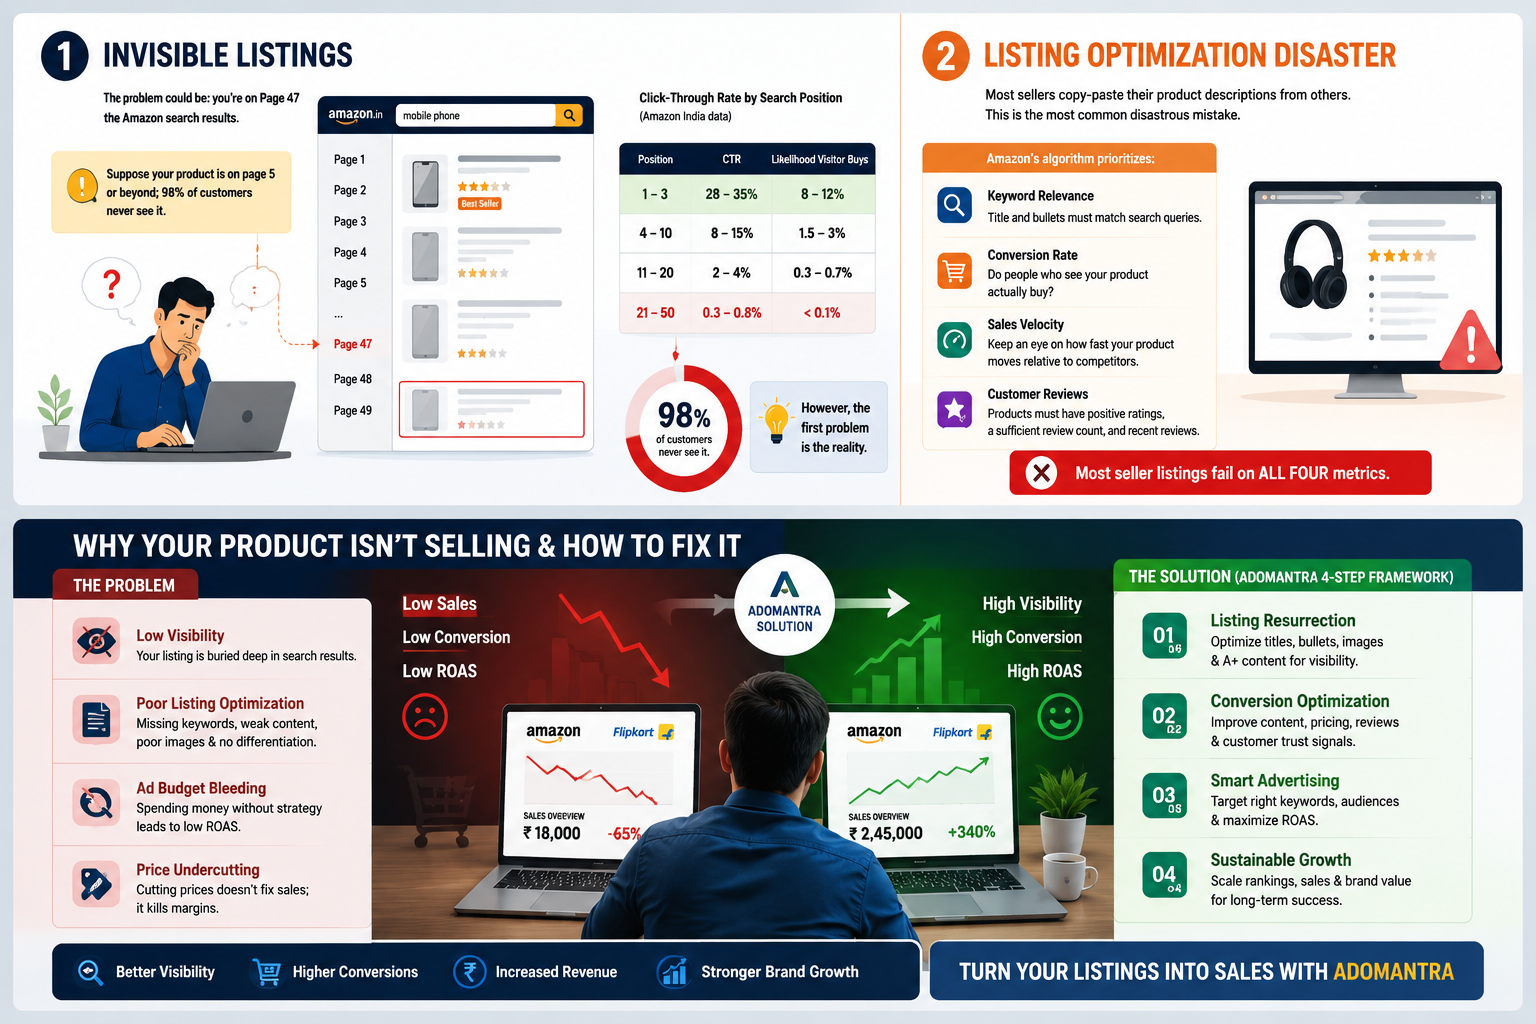
Here Comes Adomantra: The E-Commerce Turnaround Specialist
With decades of experience, we have seen so many ups and downs in the e-commerce industry. The team of Adomantra often sees that the e-commerce seller they worked with asked the same question: “Why My Product Is Not Selling on Amazon and Flipkart”
In reality, no one asked it clearly; instead, they asked derivatives like Why is my Amazon product not selling And why my product is not selling on Flipkart Well, the confusion itself is a problem.
This led to our e-commerce sales acceleration framework. This is a systematic approach to identifying and fixing the actual reasons products don’t sell.
The Real Impact For a Well-Known FMCG Brand
For a leading FMCG brand, Patanjali, the challenge was not product quality but marketplace performance. Despite having a reputable brand name and a diverse product portfolio, several products on Amazon and Flipkart were still struggling with low visibility and inconsistent sales.
Before partnering with Adomantra, the performance metrics across the selected product categories were:
- Product Views: 85,000/month.
- Orders: 450–600/month.
- Conversion Rate: 0.6%.
- Monthly Revenue: 18–25 Lakhs.
- Monthly Inventory Holding Cost: 4–5 Lakhs.
- Monthly Loss: 6–8 Lakhs.
Read More: Benefits of SEO for Your Business
At this point, the frustration was that your high-quality products are available at competitive prices, yet nobody buys them.
On the contrary, Adomantra conducted a 72-hour audit covering the following:
- Listing Analysis: Product titles, bullet points, descriptions, A+ content, and images.
- Keyword Research: What customers actually search for.
- Competitor Benchmarking: Who's ranking #1-3, and why.
- Ad Performance Review: Current spend, ROAS, and targeting.
- Pricing Analysis: Is it really a price issue
The key findings were:
|
Issue |
Impact |
Fix Difficulty |
|
Title Misalignment |
Missing 60% of relevant searches |
Easy (1 hour) |
|
Weak Bullet Points |
No differentiation from competitors |
Easy (2 hours) |
|
Poor Product Images |
40% higher bounce rate vs. competitors |
Medium (1-2 days) |
|
Zero Customer Reviews |
Algorithm downranks new products |
Long-term (3-6 months) |
|
Ad Targeting Too Broad |
78 spend is wasted on unqualified clicks |
Easy (1 day) |
|
Pricing Not Competitive |
Actually, 5-8% cheaper than top competitors—not visible |
Medium (strategy shift) |
Adomantra's Change: 4-Phase Transformation
To address these challenges, Adomantra executed a structured four-phase marketplace growth strategy, which goes like:
Phase 1: Listing Resurrection (Weeks 1-2)
First, we started with title rewriting. Although it was a simple tweak, it was important; the old one was like “Patanjali High Protein Atta 5kg”. And we changed it to: Patanjali high protein atta, rich in protein and fiber, healthy wheat flour for daily nutrition, 5kg pack.
Why the Change Was Important
- Included high-intent keywords that customers usually search for.
- Underlined nutritional benefits and talked about protein and fiber.
- Improved product relevance for health-conscious buyers.
- Increased keyword coverage for organic search visibility.
Read More: Search Engine Optimization Services
Bullet Point Optimization
- High Protein Formula: Targets searches like “high protein atta” and “healthy wheat flour”.
- Rich in Dietary Fiber: Targets “atta for digestion” and “fiber-rich flour”.
- Suitable for Daily Rotis and Parathas: We ensure to address everyday use cases.
- Trusted Patanjali Quality: Influences strong brand recognition.
- 5kg Value Pack for Families: Targets family and bulk-purchase buyers.
Image Optimization
- Clicked product pack on a clean white background to make it eligible for various marketplaces.
- Created banner images with keywords like fresh rotis prepared using Patanjali High Protein Atta.
- Showcased a nutritional benefits infographic.
- Highlighted ingredient quality and sourcing clearly.
- Lifestyle image showing family consumption and healthy eating.
Result After Phase 1
- The ranking of the primary keyword improved from Page 18 to Page 4.
- Search impressions increased from 18,500 to 46,200 (this increase was around +150%).
- CTR improved from 0.42% 1.15% (+174%)
- Product page visits increased from 4,800 12,900/month (+169%).
Read More: Pay Per Click Advertising Services
Phase 2: Pricing and Positioning (Weeks 2-3)
Patanjali products were competitively priced across various categories, but the key categories, such as health or wellness, weren’t communicated on marketplace listings:
Positioning Strategies We Worked With
- We maintained existing pricing to keep the brand competitive.
- Highlighted value propositions such as “High Protein”, “Natural Ingredients”, “Ayurvedic Formulation”, or “Family Value Pack,” depending on the SKU.
- Came up with combo packs to increase basket size.
- Added comparison creatives or infographics to highlight the nutritional advantages and quantity benefits over competing products.
- Optimized pack-size strategy for both first-time buyers and repeat customers.
Result:
- Average order value increased from 620 to 910.
- 28% of the marketplace's total revenue came from combo sales.
- Conversion rate went up by 31%.
- The rate of repeat purchases went up by 22%.
Phase 3: Review Building (Weeks 4-8)
If there are zero reviews, this directly means an algorithm penalty. Therefore, new products automatically rank lower than established products even if the quality is the same.
Key Strategies in 3rd Phase
- Post-Purchase Email: “Help us improve. Leave a review in 5 minutes”.
- Incentivized Reviews: Leave a review, get a 500 Amazon voucher”.
- Early Reviewer Program: Send free samples to 20 reviewers who buy >2L products on Amazon.
Read More: Digital Marketing Strategies
Now the target with this strategy was to reach 50 reviews in 2 months, which was easily achievable. And the reason why we adopted this strategy was that at least 50 reviews with a 4.2-star rating push the product into the “Top Sellers” category. At the end, it triggers an algorithm boost.
Phase 4: Performance Marketing Overhaul (Weeks 4 Onwards)
For performance marketing, the old ad strategy was broad category targeting, a 5 lakh/month budget, and 1.4x ROAS.
The strategy implemented by Adomantra was:
Campaign 1: High-Intent Category Keywords (2 lakh/month)
- Target: “high protein atta”, "healthy wheat flour”, “organic honey”, and “cow ghee”.
- Bid Strategy: Target ROAS 3.5x (not maximum impressions).
- Daily Budget Cap: 400/day.
- Expected ROAS: 4.0x–4.8x.
Campaign 2: Competitor Conquest Campaigns (1.2 lakh/month)
- Target Customers Searching: “Aashirvaad Atta”, “Tata Sampann”, and “Dabur Honey”.
- Ad Copy: “Trusted Ayurvedic Brand”, “Better Value Packs”, and “Natural Ingredients”.
- Expected ROAS: 3.2x–4.0x.
Campaign 3: Retargeting and Repeat Purchase Campaigns (1 lakh/month)
- We started to target the audience, such as product page visitors, cart abandoners, and existing customers who viewed the product but didn't buy.
- Diverted promotions for combo packs, family packs, subscription offers, and frequently purchased products.
- Expected ROAS: 5.5x–6.5x.
Campaign 4: New SKU Expansion Campaigns (80,000/month)
- If one SKU succeeds, it will strengthen the category.
- Test: “Honey”, “Cow Ghee”, and “Amla Juice” with a similar strategy.
- Expected ROAS: 3.0x–3.8x.
Now the total new budget is 5 lakh/month. It was exactly the same as earlier, but
3x more effective through strategic allocation.
Results Achieved Within 6 Months
After using Adomantra's marketplace optimization and performance marketing strategy for six months, Patanjali could see clear improvements on both Amazon and Flipkart.
The key outcomes were:
|
Metric |
Before Adomantra |
After Adomantra |
Growth |
|
Search Impressions |
18,500/month |
1,25,000+/month |
+576% |
|
Product Page Visits |
4,800/month |
38,000+/month |
+692% |
|
CTR |
0.42% |
1.85% |
+340% |
|
Conversion Rate |
0.8% |
2.4% |
+200% |
|
Average Order Value |
620 |
910 |
+47% |
|
Repeat Purchase Rate |
Baseline |
+22% |
Significant Growth |
|
Advertising ROAS |
1.4x |
4.6x |
+229% |
|
Monthly Marketplace Revenue |
18 Lakhs |
78 Lakhs+ |
+333% |
The Common Objections (And Why They're Wrong)
When Patanjali's marketplace growth journey began, several assumptions were limiting the brand's performance on Amazon and Flipkart. These are not unique to Patanjali. In fact, many FMCG brands face the same challenges.
Through fact-based analysis and marketplace optimization, Adomantra helped brands separate these common perceptions from reality and identify the actual growth opportunities:
Objection 1: “My Product Category Is Too Competitive”
Adomantra has worked in 15+ categories, including:
- Electronics (88 clients).
- Fashion (124 clients).
- Home appliances (56 clients).
- Consumer goods (203 clients).
- All achieved 2-4x revenue growth despite “high competition”.
In reality, customers don’t buy the cheapest product in a category. They buy from the most visible product (ranking one), the most trusted product (the one with many reviews and high ratings), and the product that is more relevant or solves the customer’s specific problem.
Adomantra optimizes for all three. Competition doesn't matter.
Objection 2: “My Prices Are Already Low, Can't Cut Further”
Most sellers blame price for poor sales, but it is rarely the issue.
While working all these years, 76% of Adomantra clients initially thought price was the problem. But after optimization, they didn’t need to cut prices.
Objection 3: “Amazon/Flipkart Algorithms Favor Big Brands”
For startups and growing brands, this remains the most common objection that algorithms are blind to brand size. But algorithms optimize for the following:
- Sales velocity (units sold / period).
- Conversion rate (clicks orders).
- Repeat customer rate (customer loyalty).
However, brands can beat a 10-year-old brand on all three metrics if the strategy is right.
Objection 4: “I Don't Have a Budget for Ads”
Adomantra works with sellers on ad budgets ranging from 10,000 to 50,000/month. If spent strategically, even 10,000/month can generate 2-3x ROAS.
Most struggling sellers aren't spending too little on ads. They're spending inefficiently (50,000at 1.0x ROAS = worse than 10,000 at 3.5x ROAS).
How to Partner with Adomantra for E-Commerce Growth
Adomantra offers complete e-commerce solutions that help brands build their online presence, boost sales, and make more money while staying profitable. These solutions include:
Listing Optimization Audit (1-2 weeks)
- Analyze current listings for all keywords.
- Competitive benchmarking.
- Identify the top 30 opportunities.
- Provide prioritized fix recommendations.
- Fee: 50,000-75,000 (one-time).
Listing Rewrite and Optimization (4-6 weeks)
- Complete listing rewrite (title, bullets, description, A+ content).
- Image strategy review and recommendations.
- Keyword optimization for 30-50 keywords.
- Monthly monitoring and adjustments for 6 months.
- Fee: 1.5-2 lakhs (one-time + 6 months support).
Performance Marketing Management (Ongoing)
- Campaign audit and restructuring.
- Budget reallocation for ROAS optimization.
- Ad creative A/B testing.
- Target ROAS: 3.0-4.0x.
- Weekly reporting.
- Fee: 12-18% of ad spend (no up-front fees).
Full-Stack E-Commerce Growth (12 months)
- Listing optimization (months 1-2).
- Review generation strategy (months 1-6).
- Performance marketing (months 1-12).
- Pricing strategy (months 1-3).
- Expansion strategy (months 6-12).
- Account manager and weekly calls to discuss progress.
- Minimum 2x revenue growth within a few weeks.
- Fee: 3-5 lakhs and 5% of revenue growth from the baseline.
Client Eligibility:
- Minimum 10 lakhs annual e-commerce revenue (or strong offline brand).
- Serious commitment to growth (not looking for a quick fix).
- Willingness to follow recommendations (even if counterintuitive).
The Bottom Line
In conclusion, if your products are listed on Amazon or Flipkart but sales are not coming in, the problem is rarely the product itself. In most cases, the real issue lies in visibility, discoverability, conversion optimization, marketplace positioning, and advertising productivity.
Make notes: Amazon has rules. Flipkart has rules. Customers have preferences. Algorithms have logic.
The Patanjali case study proves this. By employing a structured marketplace growth strategy, Adomantra transformed underperforming product listings into high-growth revenue generators.
At Adomantra, we help brands move beyond simply being present on marketplaces. We help them become visible, trusted, and profitable.
FAQs
Q1: Why are my products not selling on Amazon
A: It is likely due to poor listing quality, low visibility, uncompetitive pricing, few reviews, weak differentiation, slow shipping, low demand, or policy issues.
Q2: Who is more profitable, Flipkart or Amazon
A: Both the platforms are profitable. Flipkart currently holds around 48% market share, whereas Amazon India's current market share is 31%. However, Flipkart reported revenue of about 17,900 crore with losses of 2,350 crore, while Amazon India generated revenue of 25,400 crore and faced huge losses of 3,470 crore.
Q3: Why am I getting clicks but no sales on Amazon
A: It could often be due to the wrong ad targeting or wrong keyword optimization. So, people are clicking out of curiosity but aren't actually interested in buying.
Q4: What are the 7 keys of selling
A: The 7 common steps of the selling process are prospecting, preparation, approach, presentation, handling objections, closing, and follow-up.
Recent Posts
-
 Best CTV Advertising Agency India | Connected TV Ads - Adomantra
-
 SEO vs AEO vs GEO: The Total Guide for Ranking in Google and AI Search
-
 What Are LLM SEO Services? Why SEO Alone Isn't Enough in 2026
-
 How to Get Your Products Listed on Blinkit and Zepto?
-
 How is Adomantra x IRCTC Partnership Revolutionizing High-Volume Digital Media Buying?